Elevate your local knowledge
Sign up for the iNFOnews newsletter today!

Spending and property tax are the things municipal politicians do have control over, and an issue the pubic loves to grumble about.
The value of your home dictates how much property tax a person pays, but some towns and cities pay more than others.
iNFOnews.ca had a look at the numbers to see who pays the most, the least, and how much property taxes have gone up in the last two municipal terms.
While property taxes are largely worked out as a percentage of the assessed value of a home, there are half a dozen other factors that add into property tax. School district taxes, money to the regional district and a hospital tax levy, as well as sewer and water infrastructure, garbage and recycling, and other miscellaneous costs depending on where you live. It’s also worth noting that the figures don’t account for inflation.
We used the total amount of residential property tax paid, including the other taxes and charges, along with average property value put out by the province – which differs from those used by real estate organizations.
Here is what we found.
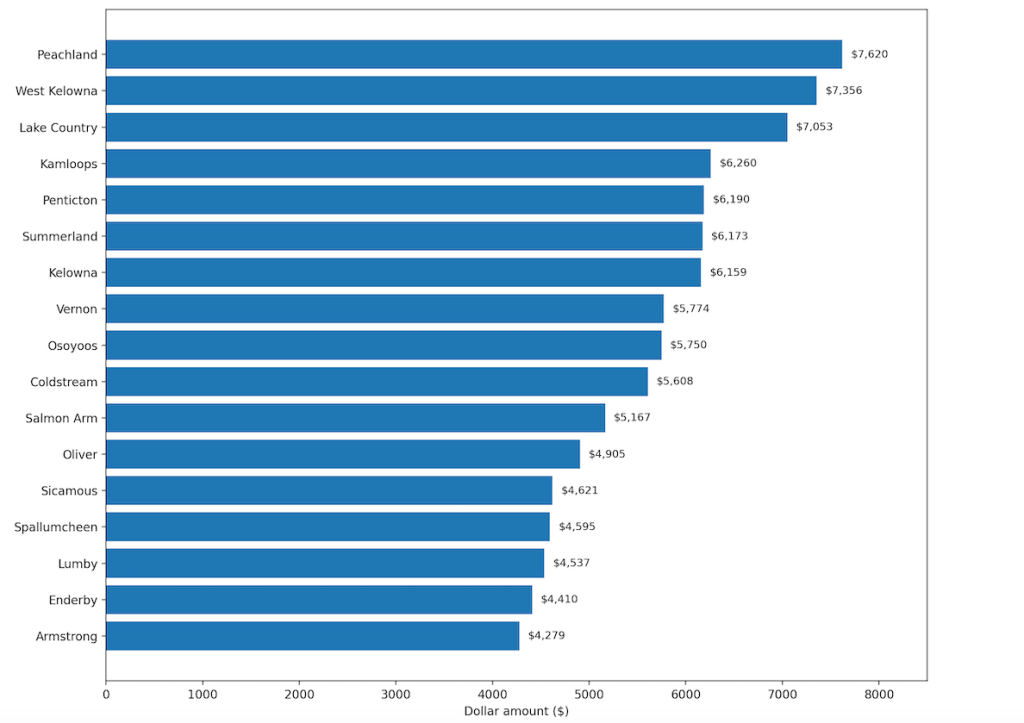
Peachland doesn’t have the priciest properties in the region but in 2026 paid the steepest property tax bill at $7,620. So while the average home in Peachland is about $100,000 less than the average home in Kelowna, the average Kelowna property owner paid about $1,500 less than in Peachland.
The second highest bill went to West Kelowna, followed by Lake Country, Kamloops and Penticton.
Average property tax bill 2026
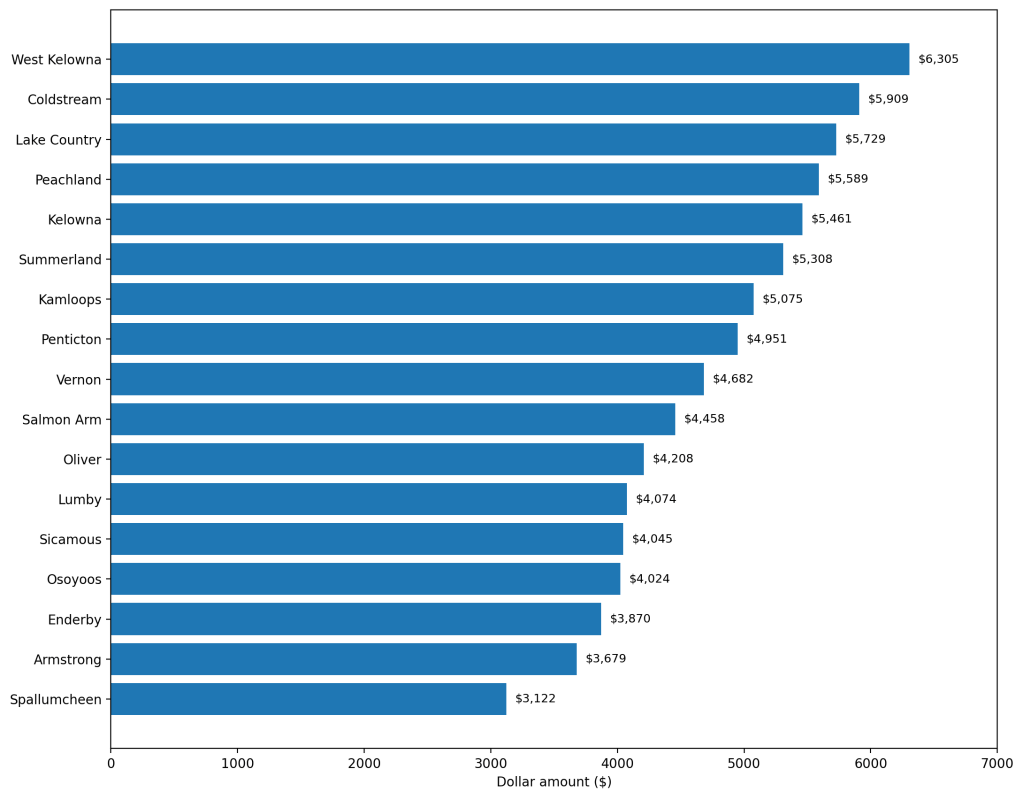
That’s where it stands now, but in 2023, one year into a municipal council’s term, West Kelowna took the top spot.
Average property tax bill 2023
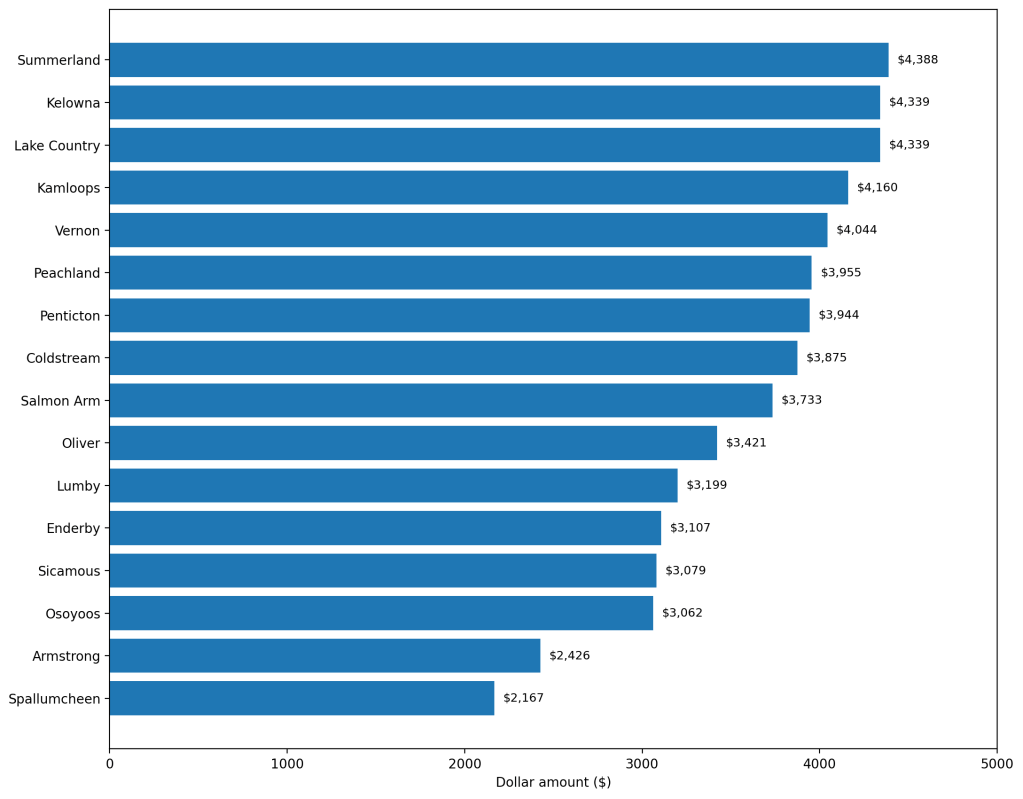
And in 2018, Summerland took the top spot.
Average property tax bill 2018
Local governments account for property price increases, so if your home went up 25%, that doesn’t mean your property tax will go up 25%.
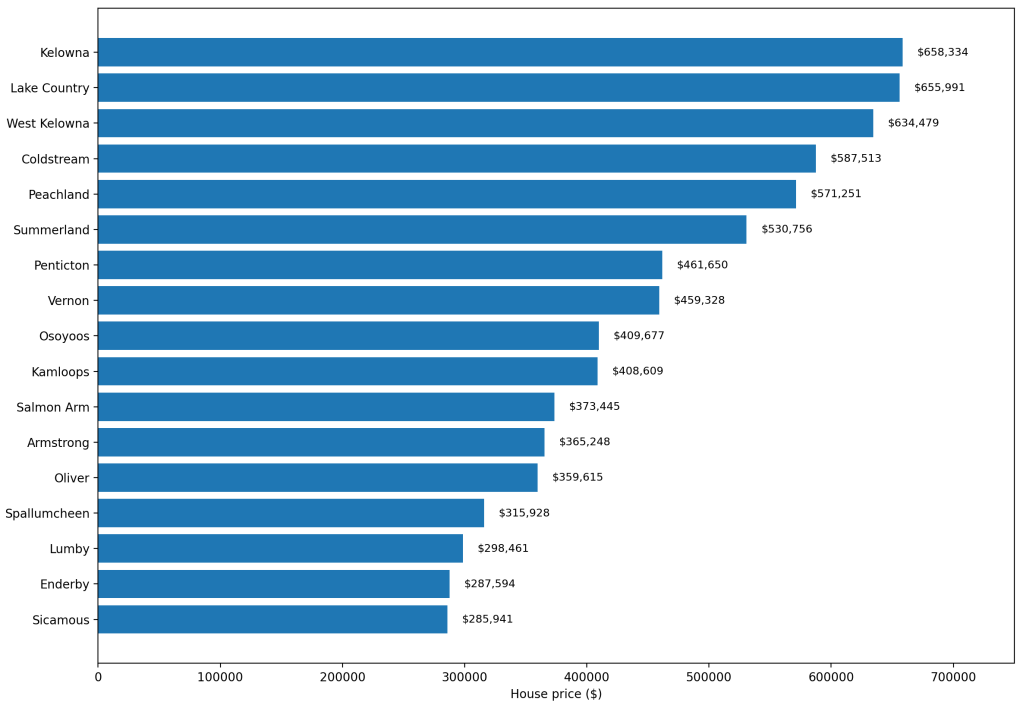
Average Property Price 2018
Average Property Prices 2026
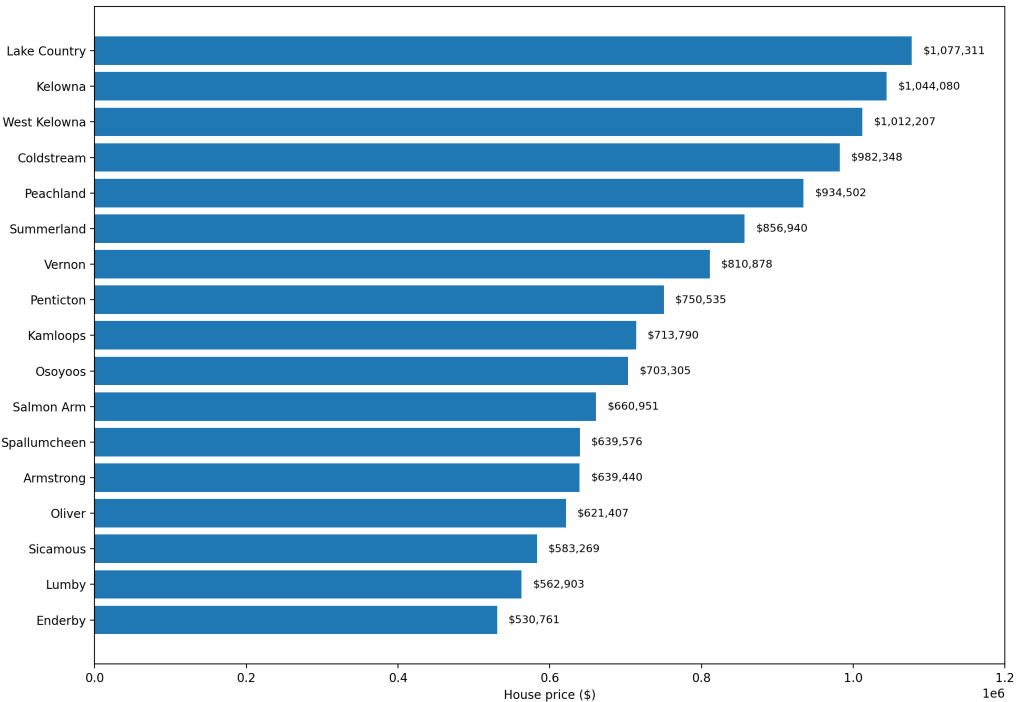
While Lake Country and Kelowna have the most expensive properties in the region, smaller communities saw far steeper increases in the price of housing.
Prices in Sicamous increased more than anywhere else in the region, more than doubling since 2018. Prices also doubled in Spallumcheen, which came in second place.
Lumby and Enderby took third and fourth place with increases over 80%, with Salmon Arm in fifth position with a 77% increase. Kelowna saw a 58% increase since 2018, but came in last place.
Percentage Increase in Property Prices between 2018 and 2026

The rate at which property prices increase don’t mirror property tax increases. Many communities see higher increases in property tax regardless of whether property prices have moved.
How much taxes are going up is often seen as a reflection of how well council is doing.
Percentage Increase of Property Tax 2018 to 2023
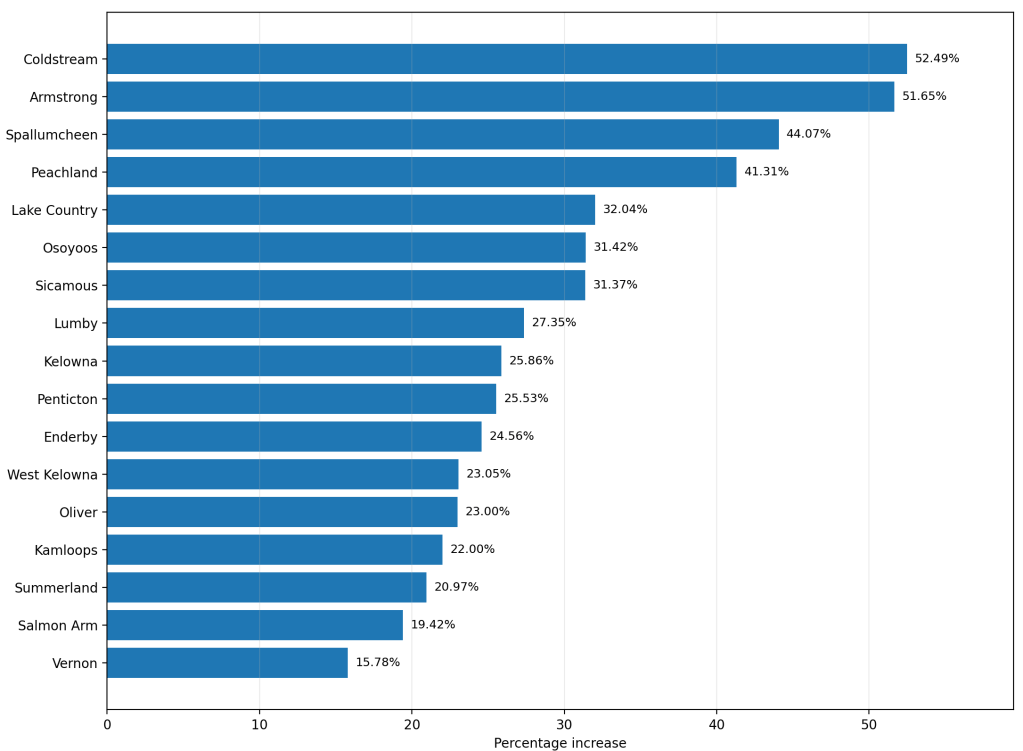
Over the last two terms, just under half of towns and cities in the region have seen property tax increases over 50%.
Property Tax Percentage Increase 2018 to 2026

News from © iNFOnews.ca, . All rights reserved.
This material may not be published, broadcast, rewritten or redistributed.
This site is protected by reCAPTCHA and the Google Privacy Policy and Terms of Service apply.
Want to share your thoughts, add context, or connect with others in your community?
You must be logged in to post a comment.